
the solution
The idea
The idea behind the CoDrive algorithm was born in the world of rally racing, where the “navigator” (or “co-driver”) helps the driver in two stages:
– first (the day before the race) taking notes (we call them “notes“) on all the corners of the track
– then, during the race, using those notes to give precise real-time directions on how to tackle each section.
CoDrive replicates all of this digitally, acting as an intelligent driving assistant capable of automatically creating these “notes”, so as to communicate in advance, as each bend approaches, its category, which identifies its characteristics, including the level of difficulty, thus helping the driver to use the right steering angle, the level of braking and the moment to accelerate, to better face it


Our algorithms
Tested over 500,000km worldwide
They were developed by the professional driver Paolo Andreucci (multi-champion of rally), as well as federal driving instructor, who perfected the algorithm after testing over 500,000km all over the world, and encoding the same information that a real rally "navigator". The algorithm is able to automatically classify each curve of each route, and then check in real time whether the driver is negotiating the curves adequately for the corresponding category.
They adapt thanks to Artificial Intelligence techniques
Thanks to the support of expert technological partners in the sector, the algorithms have been implemented also making use of sophisticated Artificial Intelligence techniques, which facilitate the automatic classification of the curves.


First Algorithm
The core of CoDrive: the automatic calculation of "notes"
Choose your Version....

Second Algorithm
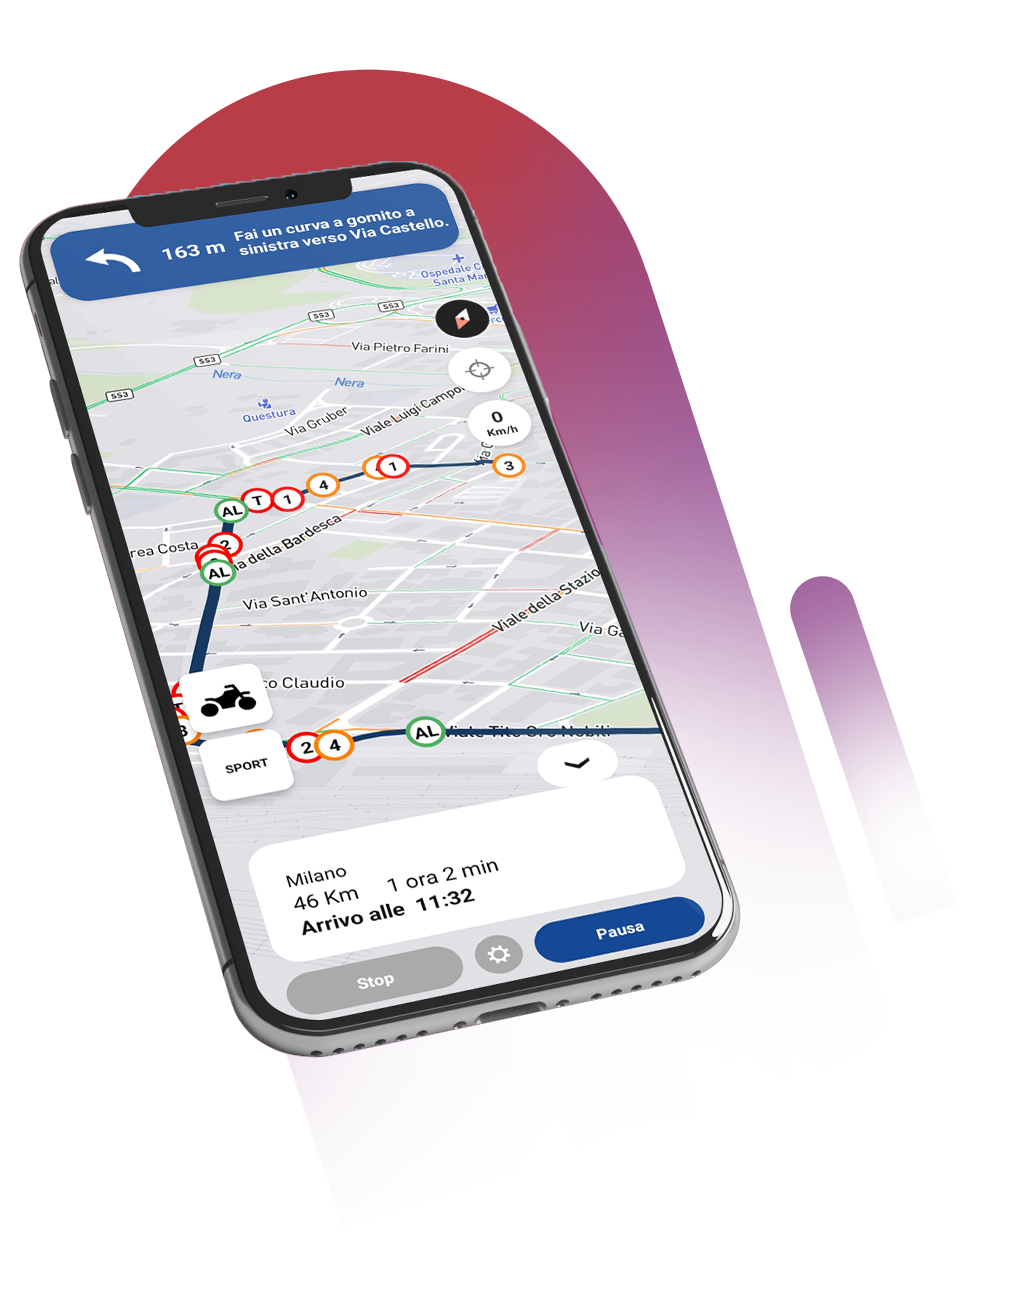
Alert notification
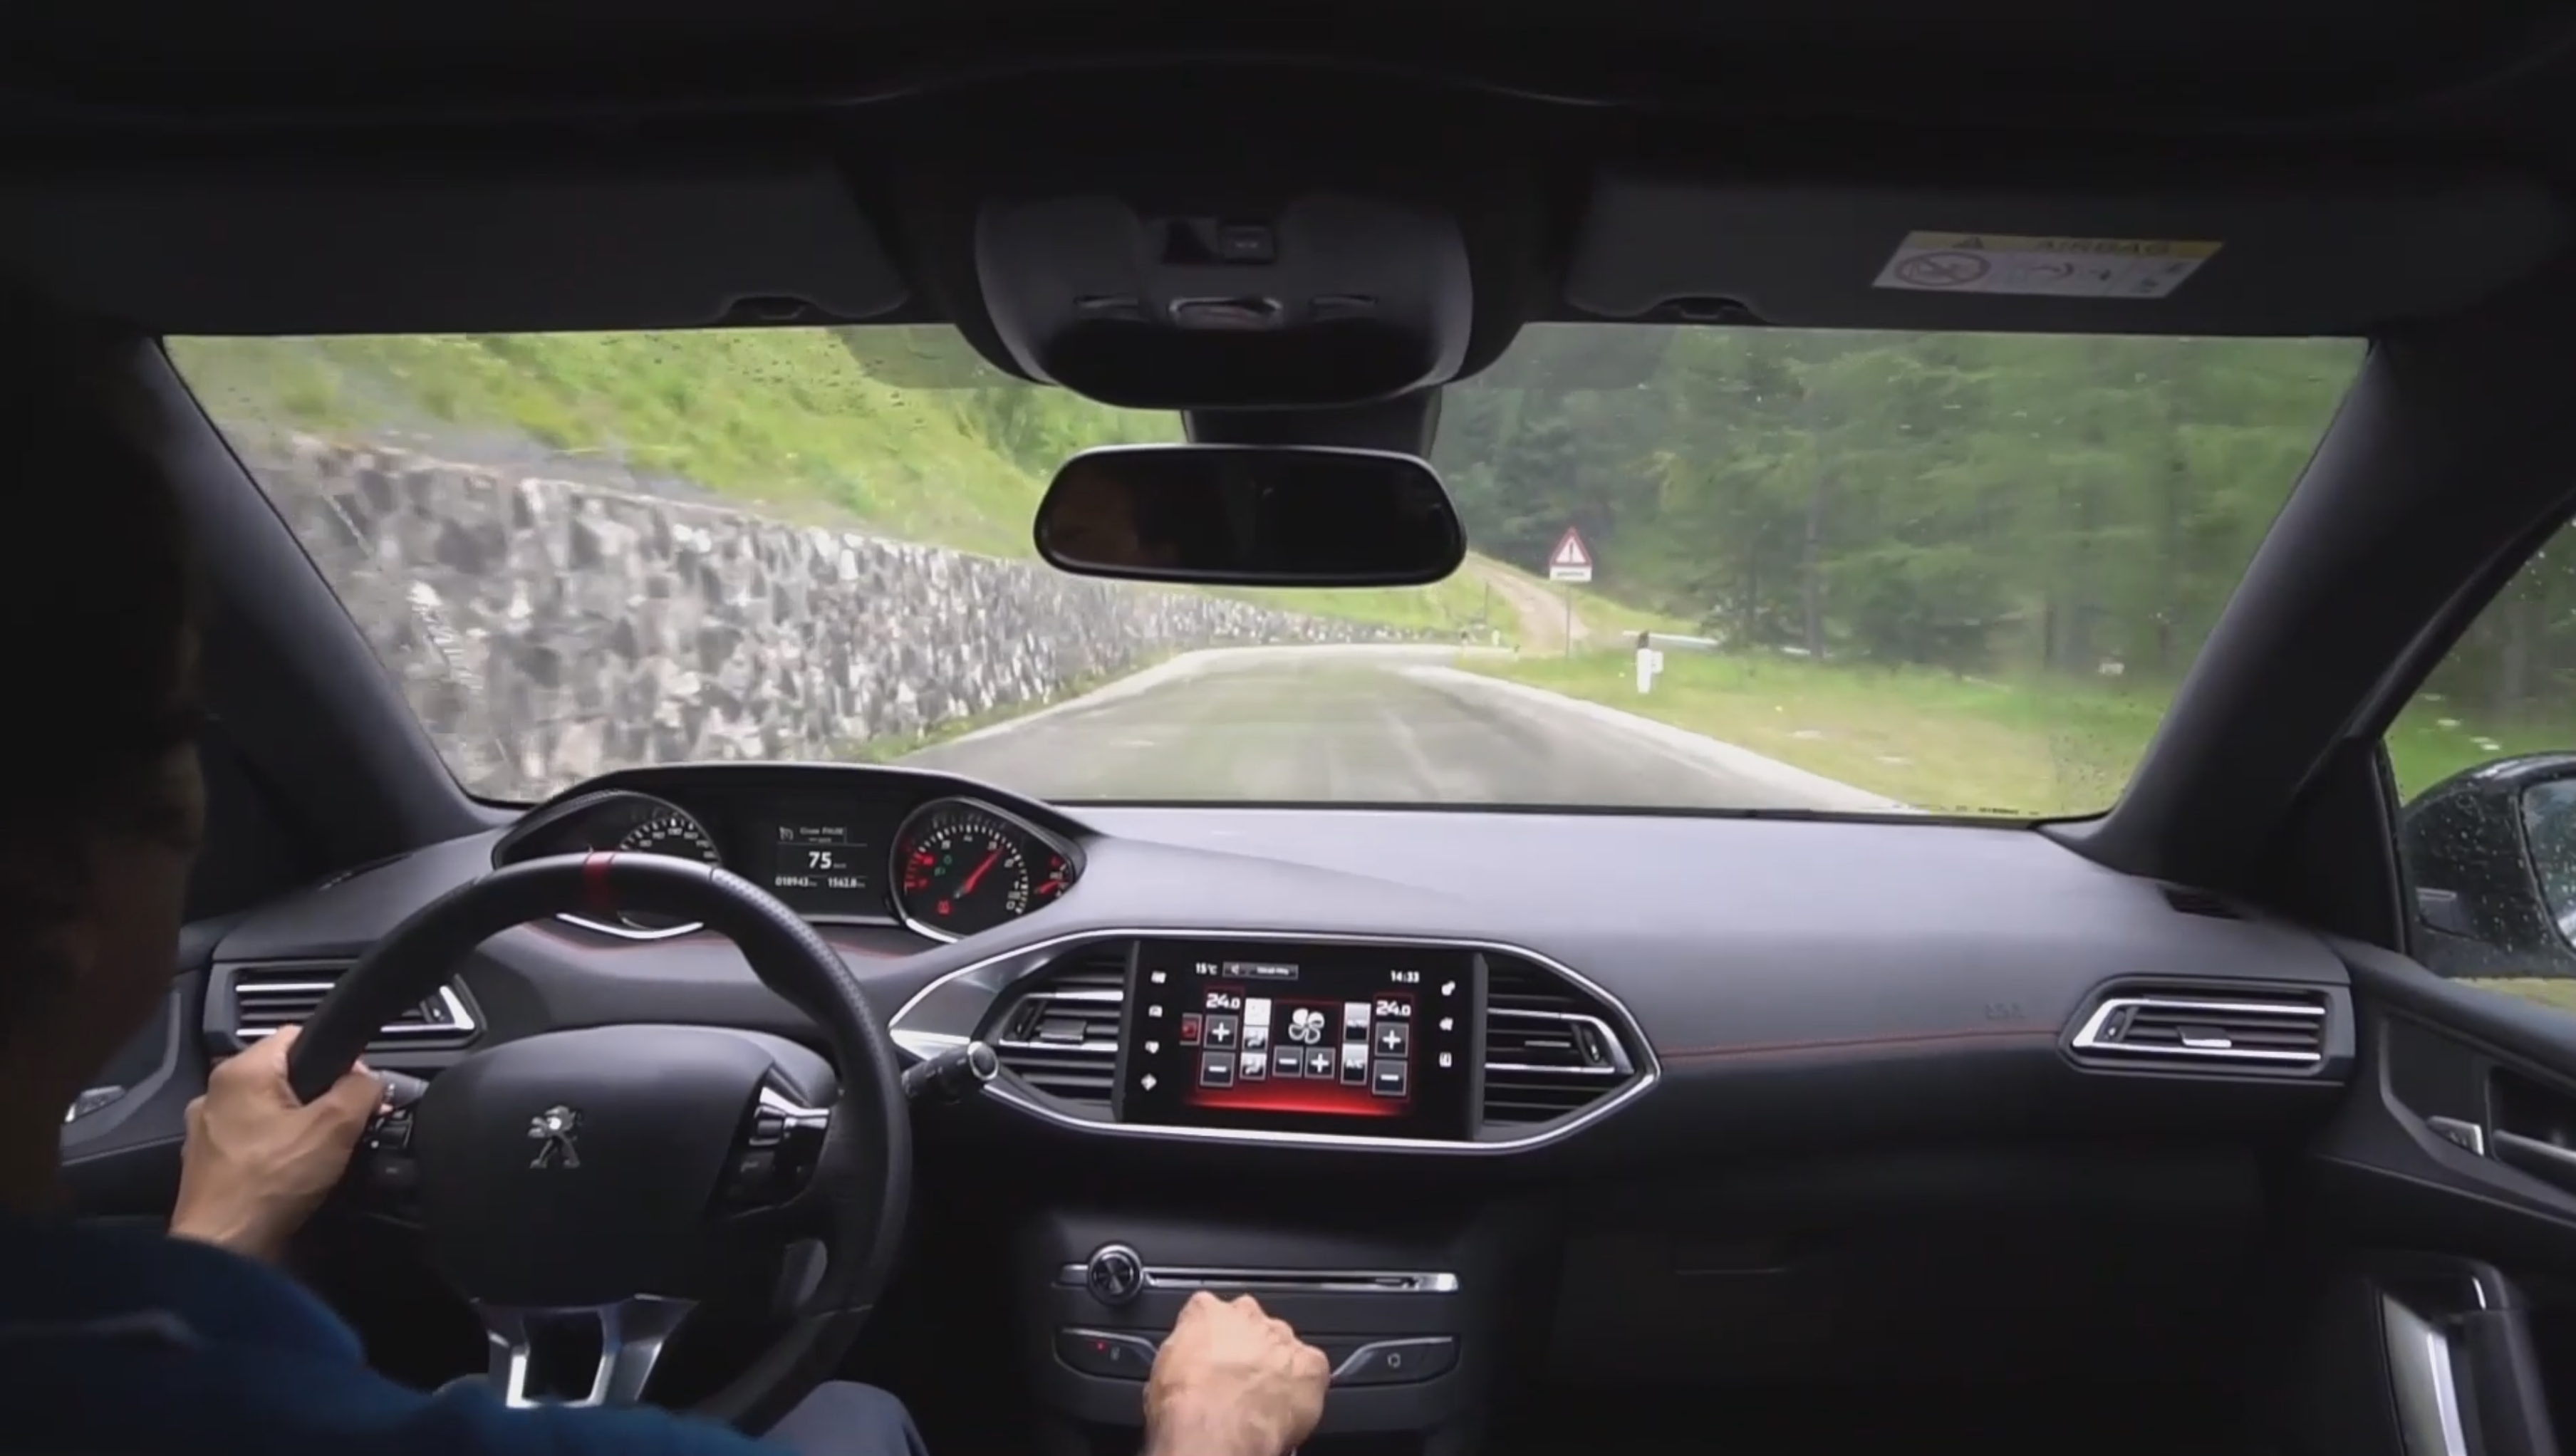
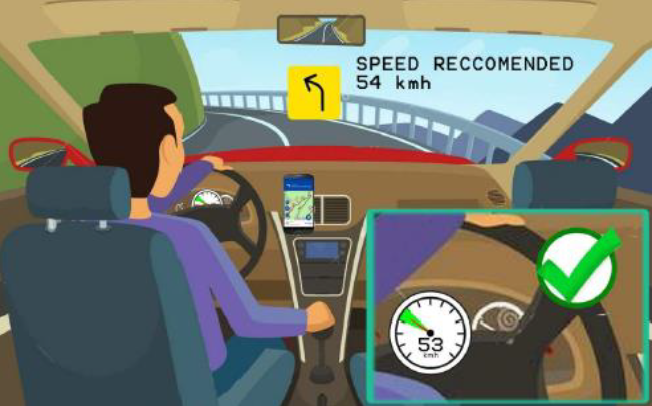
While driving, the “notes” about the next curves are communicated to the driver with the right anticipation so that he can prepare for them in the best possible way.
The parameters detected in real time such as driving speed and acceleration are constantly compared with the expected values (the right range of expected values) for that given curve; in the event of excessive differences, a warning sound is immediately sent to warn the driver.
Third Algorithm
Driving behavior analysis
Once the journey is over, the driving style classification algorithm assigns a “score” to the performance just performed, taking into account how well or poorly the various curves were tackled.
The “journey replay” option allows the driver to review their journey and see how the performance has been compared to the right way to approach each corner, giving them the opportunity to see where mistakes have been made and thus allowing them to understand how to improve the own driving style.
Evaluated parameters and risk factors
Cornering speed
Average speed
Violent accelerations
Curvature of curves
Sudden or abnormal braking
Driving distractions
Sudden moves
The parameter to which greater importance is given is the traveling speed measured for each individual curve, which is compared with the range of values considered correct for the corresponding category to which this curve belongs: if the measured value falls outside this range, the curve a negative score is assigned, the greater the greater the difference between the measured value and the exceeded threshold. If you intend to reward not only safety, but also consumption, during the configuration phase you can decide to give slightly negative scores even to deviations below the lower threshold, because too low a speed causes an incorrect subsequent acceleration mode at exit of the curve, penalizing in terms of consumption.
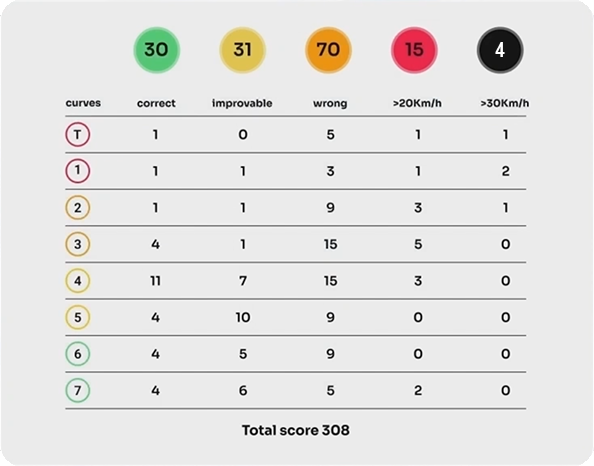
The readings on the single curve are then grouped into error classes, reported as columns of the specific route report (indicating these classes with different colors, ranging from green, which indicates correct curves, to black, which indicates curves with errors very serious). Each row corresponds to a different category of curve: the value at the intersection of a given row and column shows the number of curves, for that category, whose error fell within the corresponding class (e.g., in the example report the number “1” shown in position (1,1) shows that only 1 hairpin bend has been traveled correctly).
The scores are then combined, in calculating the “route” score, giving different weights to the types of errors pertaining to different categories: for example, exceeding the upper threshold by more than 20kmh is more serious for a hairpin bend than for a much less dangerous one. category “7” curve. External conditions also influence everything (amplifying the penalties in case of bad conditions).
Other parameters taken into consideration are violent accelerations and sudden braking, to which a score is given that is inversely proportional to the excess detected.
Finally, another important element for the purpose of evaluating driving safety is the number of “distractions” understood as the number of “events on the mobile phone” detected by the same as “manually processed” (e.g.: call made without the speakerphone, which presupposes the driver was holding the phone).